RSI Indicator
The RSI (Relative Strength Index) indicator is one of the most important and famous indicators used by traders around the world. An EO Broker beginner might not understand how to use EO Broker and earn money. We’ll try to explain.
By its nature, the RSI indicator is an oscillator, that is, it fluctuates in a certain zone, limited by the maximum (100) and minimum values (0).
This indicator displays "momentum" — the speed and amplitude at which the price movement changes and how much the price changes in the direction of its movement. In other words, the RSI indicator shows the strength of the trend and the likelihood of its change.
How the maximum (100) and minimum (0) values of the indicator are determined:
- The stronger the relative upward movement of the price (the greater the total length of green candles for a certain period) — the closer the indicator value is to 100.
- The stronger the relative downward movement of the price (the greater the total length of the red candles for a certain period) — the closer the indicator value is to 0.
We won’t get into the details of the formula on which the indicator is built, but it's quite simple. The indicator is based on the analysis of the closing prices of candles for a certain period of time and their relative difference. Note that candle shadows are not taken into account when constructing the indicator chart, only the closing values. In other words, the indicator shows how strong the movement is over a certain period of time, based on the "strength of the candles" for this very period.
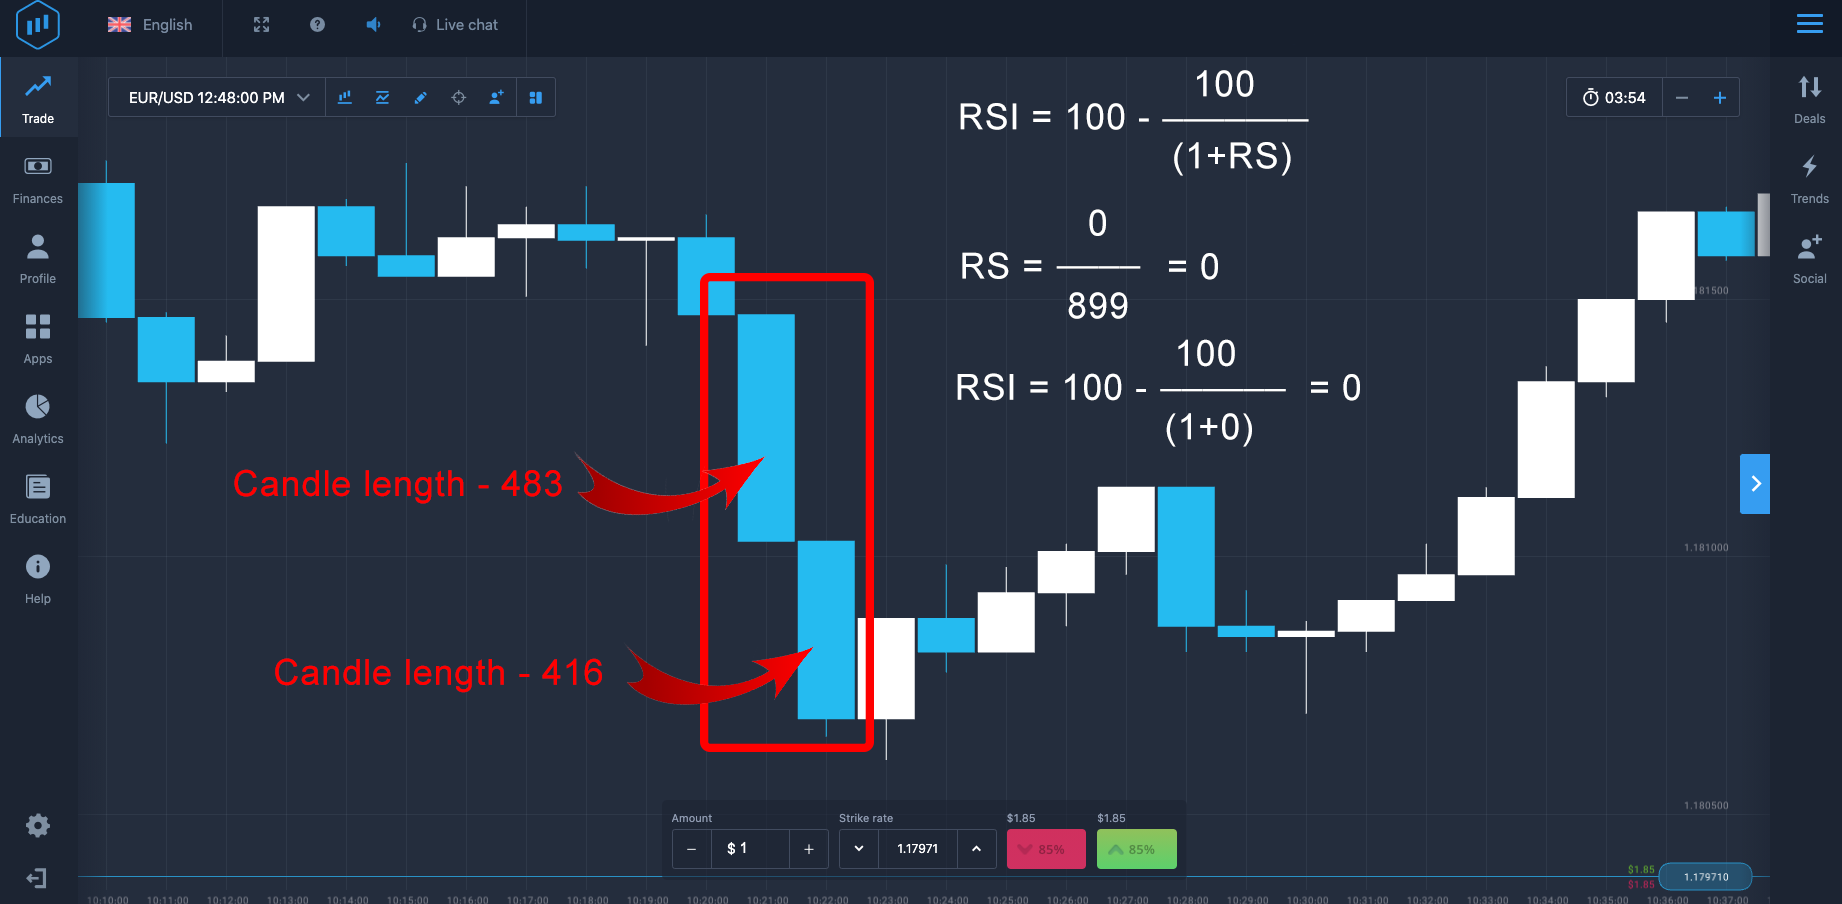
To put it simply, based on the chart, the RSI indicator analyzes the sum of the candlestick lengths (their strength) relative to a certain period.
Overbought/Oversold
As already mentioned, the RSI indicator line ranges from 0 to 100. But the levels of 30 and 70 are equally important. Often, when analyzing the data of the RSI indicator, you need to consider:
- If the indicator value rises to 70 and above, the asset is overbought and it's unreasonable to start buying now. Or even better — you need to exit the asset or pull the stop loss higher, preparing for a possible trend reversal.
- If the indicator falls below 30, the asset is oversold and you run the risk of selling it at the very bottom. This is a good opportunity to consider buying.
But if everything were so simple, we would all have become millionaires long ago, right?
The point is sometimes it happens that the RSI value can be in the overbought zone for quite a long time (and the price will continue to go up at this time) or in the oversold zone (the price will continue to go down at this time). So you should also be able to filter RSI signals either by changing indicator settings (we'll talk about this later), or by using other indicators and methods of technical analysis. However, it's worth mentioning that overbought/oversold signals often work out.
Leaving the Overbought/Oversold Zone
The flaw in the past method of analyzing RSI values can be corrected more safely and conservatively. We'll try to look for an entry into a position or an exit from it when the indicator value crosses its important marks — from top to bottom or bottom to top.
Determining Trend Direction
Another additional signal from the RSI indicator is determining the direction of the current trend.
It's generally believed that if the indicator value crosses the 50 mark, the trend changes. Quite often, you can see how the price finds support/resistance at this level during strong trends. So if you want to make sure that the trend is indeed up, but you have doubts, wait until the RSI crosses the 50 mark. The opposite is true when looking for a downtrend. Do you have doubts? Wait for the RSI to drop below the 50 value and it'll give you another confirmation that the trend is indeed a downtrend.
Another way to identify a possible trend change using the RSI indicator is to use 20/80 levels.
How to determine
During a downtrend, the indicator value always falls to level 20 and never reaches 80. In an uptrend, the opposite is true. The indicator values are mainly at the level of 80 and come nowhere near the 20 level, signifying a stable upward trend.
So as soon as the next time in a downtrend, the indicator suddenly breaks through the value of 80 and then doesn't go down to 20 again, we can assume that an uptrend has begun, and vice versa. It's pretty simple.
Trend Levels and Support/Resistance Lines
The RSI indicator is great for finding support/resistance levels and trend lines on it. That is, the classic rules of graphical analysis apply to the RSI indicator. Quite often, a breakdown of a trend line or support/resistance on the indicator chart can suggest an impending breakdown on the price chart. At the same time, the most reliable signals come from overbought/oversold zones.
Graphic Patterns on RSI Indicator
It's hard to believe, but the RSI indicator is also unique because it can perfectly work out chart patterns, while these patterns may not be on the price chart itself. So quite often, the advance finding of a pattern on the indicator chart may indicate an upcoming change in the movement on the price chart itself (its slowdown or acceleration).
Location of Divergence
It's one of the most reliable trading methods using the RSI indicator. Divergence is the moment of divergence between the indicator values and the price, which hints at a quick trend change towards the direction of the indicator value.
For example, bearish divergence is the moment when the highs of the price rise, but, at the same time, the highs of the RSI indicator values decrease. This indicates a possible imminent reversal of the movement (the price will move in the direction of the indicator values).
Bullish divergence happens when the lows of the price decrease, but the lows of the RSI indicator values increase. This indicates that a trend change/reversal is expected soon.
Check RSI at Different Time Frames
For a more convincing entry into the market by the values of the RSI indicator, you should compare the indicator values at different time frames. While on the 15-minute chart, the RSI values may indicate oversold, on the 2-hour chart the indicator will signal overbought at the same time. Guess what values will be more valuable and significant? That's right, the values of the older TF.
How to trade on EO Broker with the RSI Indicator
What is the EO Broker RSI indicator? How to trade on EO Broker with the RSI Indicator? If you’re still asking yourself if EO Broker is real or fake here are some pointers for using EO Broker. Try using the RSI Indicator to start earning with EO Broker.
- After ExpertOption login click on the “Indicators” icon from the Menu.
- Select the RSI indicator.
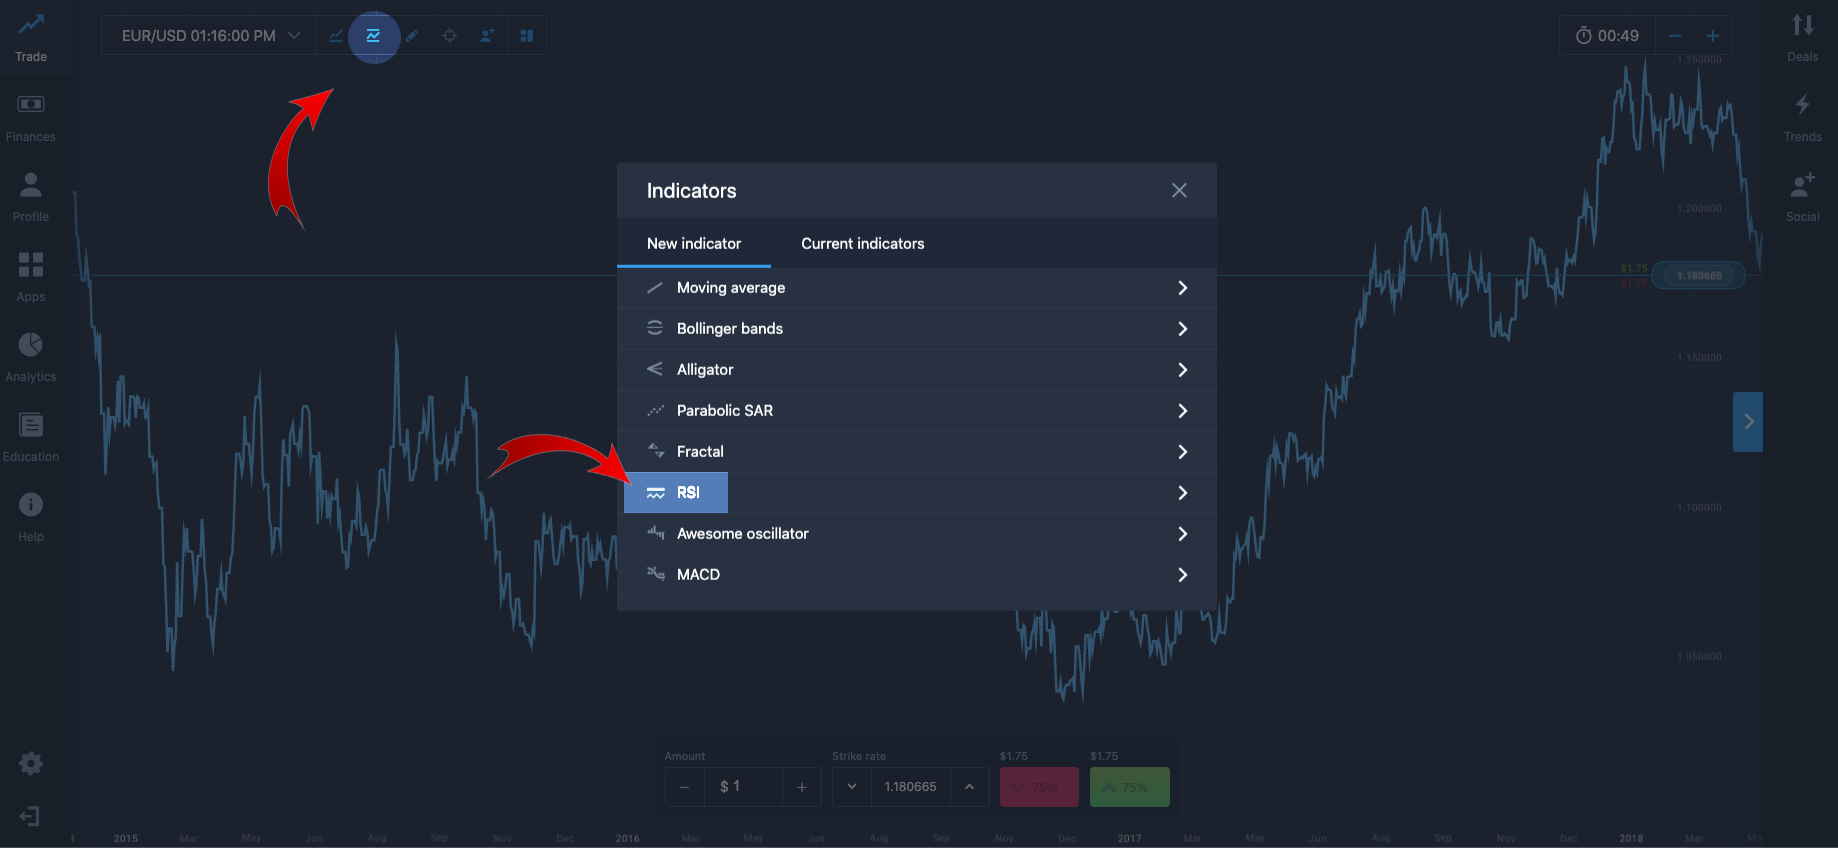
- Confirm and save settings.
- If the purple line crosses the red line, click the red button.
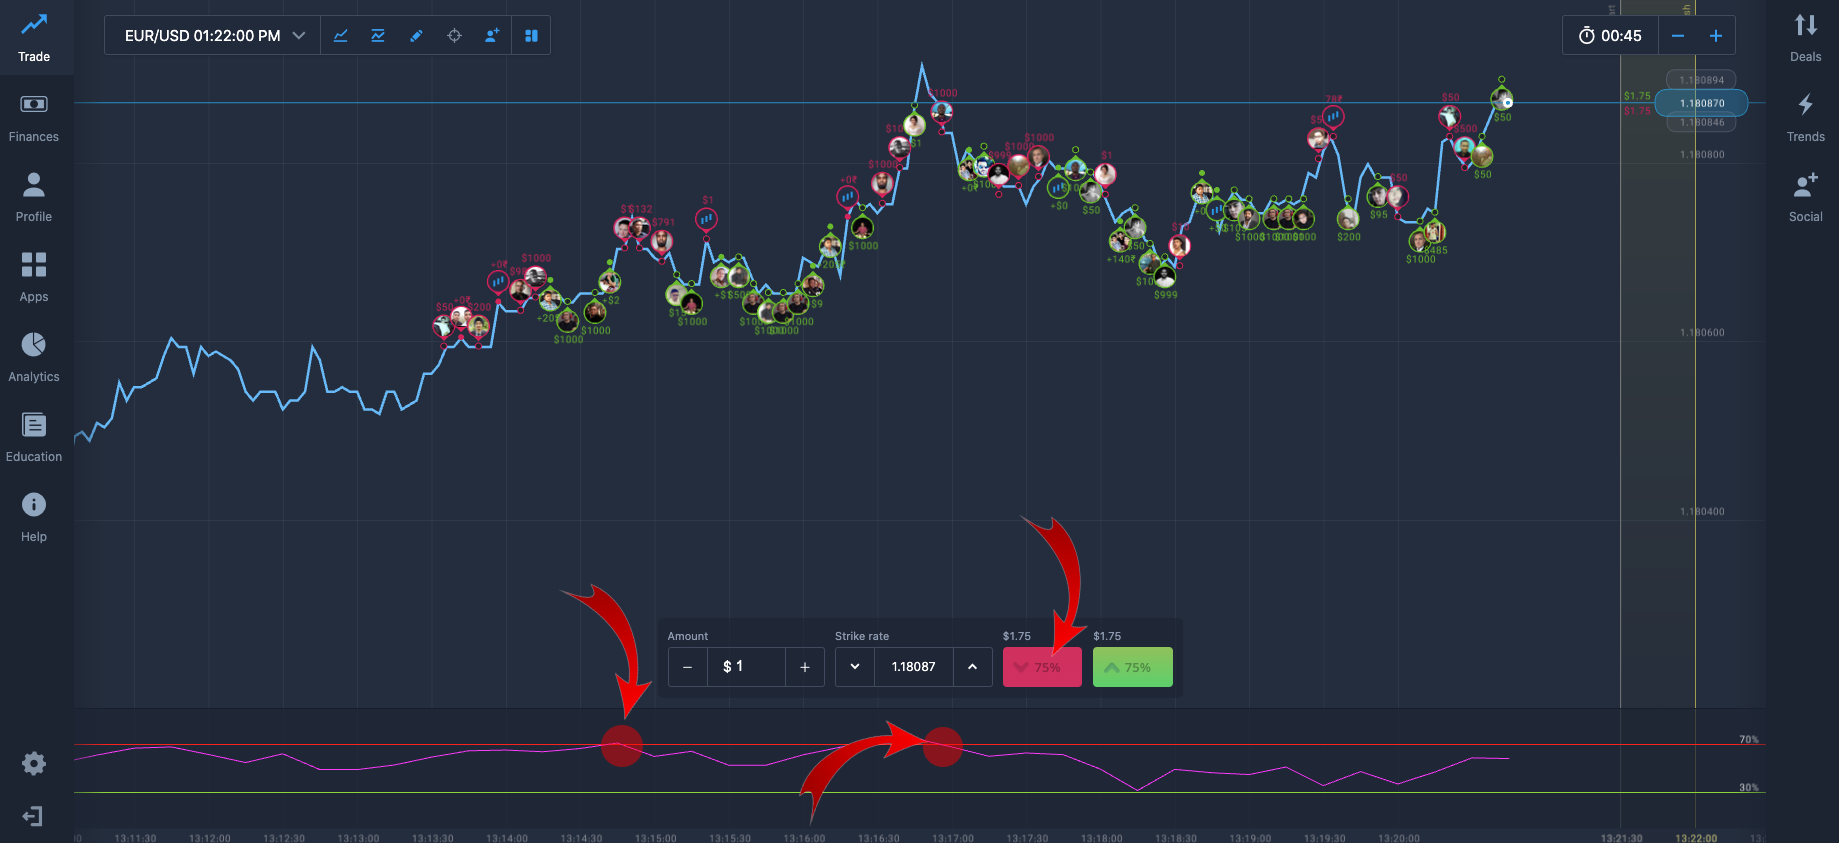
- Wait for the result. If your estimate is correct get your profit.
- If the purple line crosses the green RSI Line, click the green button.
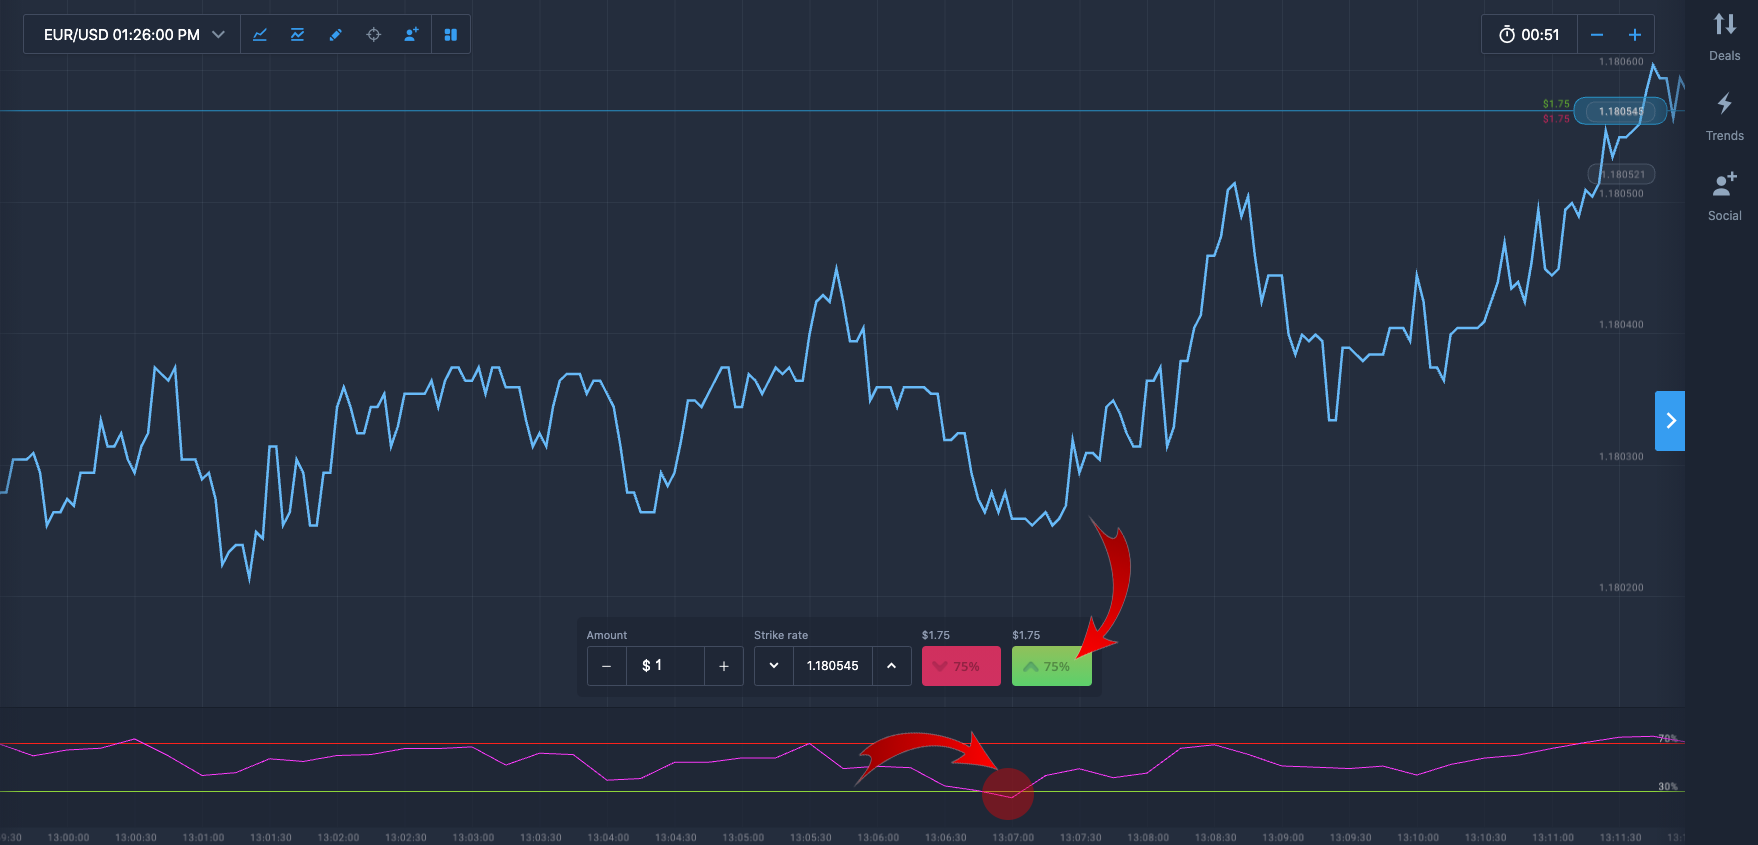
- Wait for the result. If your estimate is correct, take your profit!
Check out our article on how to deposit in EO Broker and earn more!